
It’s Time to Show the World Your Vision
If you’re like me who is just not that great at creating diagrams or any visualization of data, then you should continue reading because we are about to learn something awesome. Unlike some of my teammates who can create diagrams and make them look very organized and pleasing to the eye, I struggle in this area. Whenever we are required to create charts, I am always looking out for tools that I can use to make this task easier somehow.
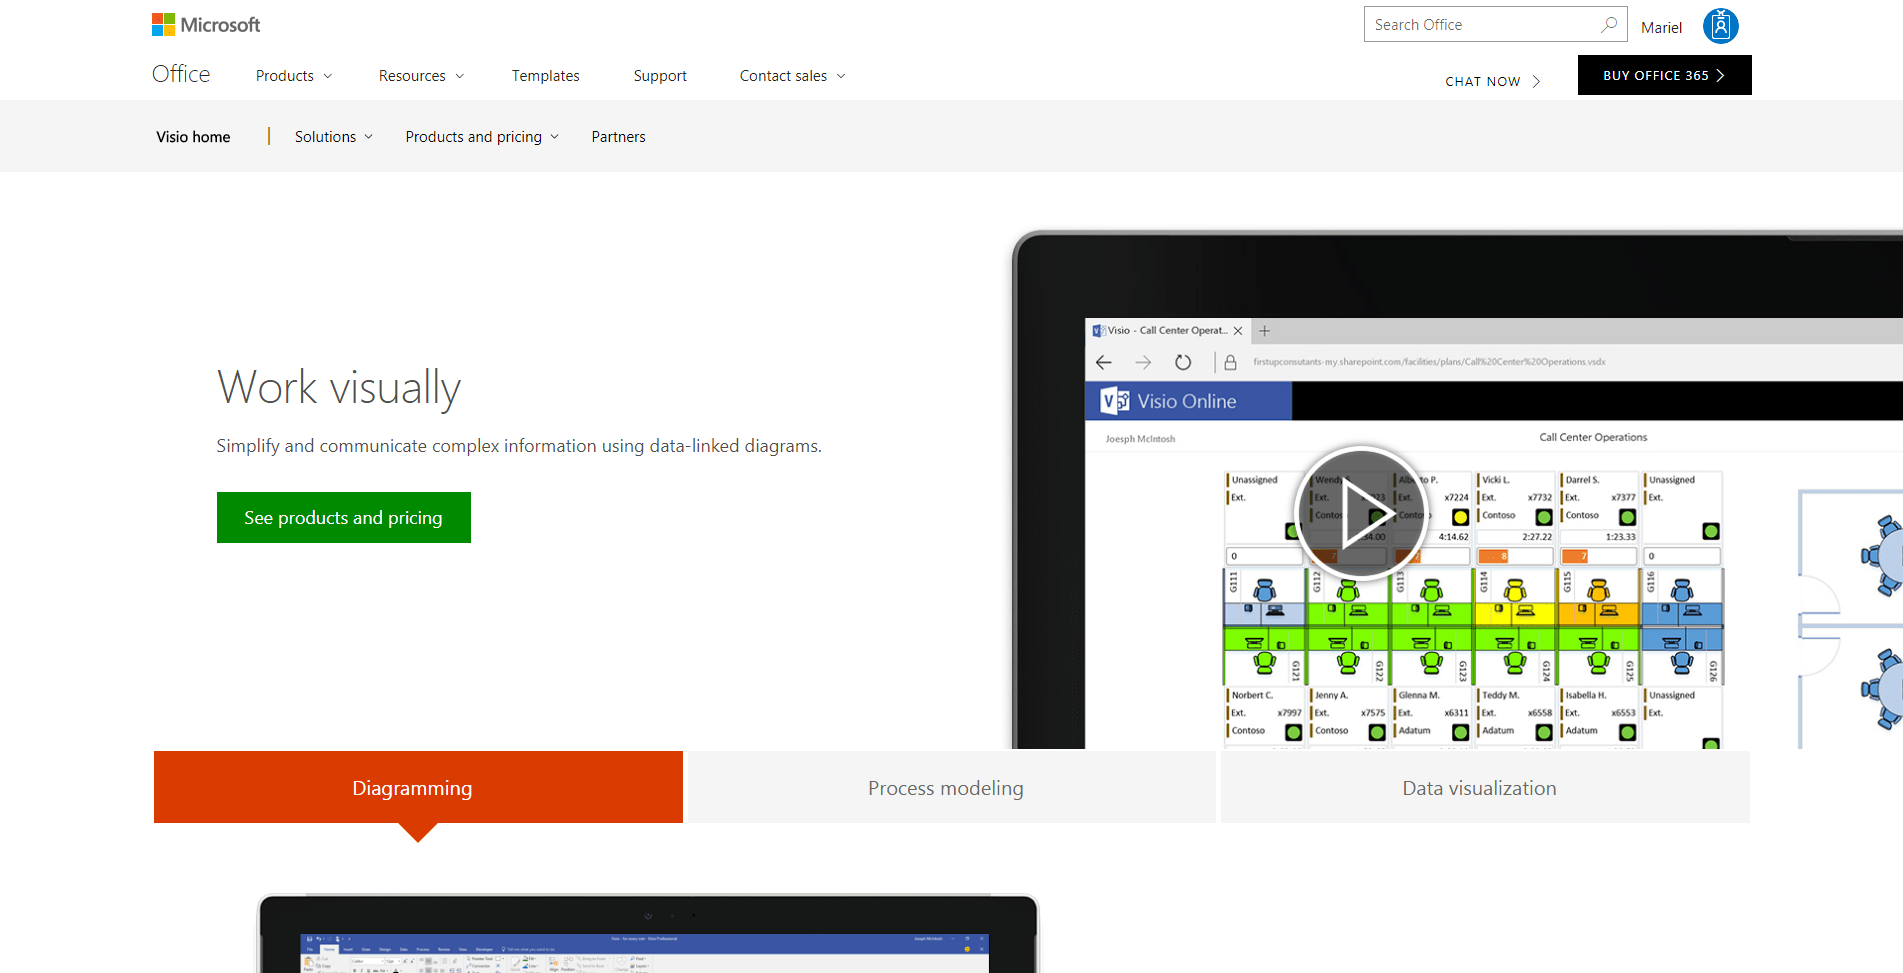
This is how I stumbled upon Microsoft Visio. This is the answer to my problem, as it has simplified the once complicated task that is the creation of charts and diagrams. But Visio is even more than that, as it offers more than just simple flowcharts.
Visio is a paid application from Microsoft, and it has three versions as of today: Visio Standard 2016, Visio Professional 2016, and Visio Pro for Office 365, and each of these versions have their pricing. You can compare the features of each and choose which one you would benefit from the most or which plan would suit your needs. The recommended version is the Visio Pro for Office 365.
Visio offers three solutions: Diagramming, Data visualization, and Process Modeling. In Diagramming, you can create the things I have mentioned above: diagrams, flowcharts, and other charts. And for the more advanced, you can also create floor plans using Visio, and engineering designs. The best thing about this is that it is effortless to get started, especially if you’re already used to the Office user experience. Another benefit of using Visio is that you can collaborate with your teammates easily and work on the same chart or diagram at the same time by using Skype for Business, which is very helpful for teammates who are working remotely or in other places.


You also have the option to use data sources for data visualization, so that you won’t have to encode manually in the chart the data that you are going to use if you already have an Excel file or a SharePoint list, and the cool thing about this is that the diagram will also be updated when your list or your file is updated. Visio also already has data graphics which you can use in your chart, but if you want to create your own, you also have the option to do so.
Once you’re done creating your diagrams, you can easily share this with people in your organization. This is very useful especially for data-linked charts or diagrams since the diagram will be updated when the data source is updated.
Visio is worth investing if you think you need extra help with the visualization of data. If you want to know more about this app, check out this link.
Send us your questions on Office 365