Customizing SharePoint Lists Using Column Formatting
Now available on “modern” SharePoint lists, column formatting is one way of applying custom formats to columns. Pretty much similar with the conditional formatting in Excel, column formatting makes it possible to apply styles to columns like CSS or modify the way data content is presented to users.
Code is in JSON format that follows a particular schema. We listed details on the syntax references below:
elmType – specifies the type of element to create which includes but not limited to the following:
- div
- span
- a
- img
- button
txtContent – specifies the text text content of the element which can either be string or an Expression object
style – specifies style attributes that will be applied to the element specified, contains name-value paired objects corresponding to CSS attributes and values such as:
- background-color
- border
- height
- font
- margin
attributes – specifies the elements additional attributes which similar to style is an object with name and value and can be any of the following:
- href
- src
- class
- title
- target


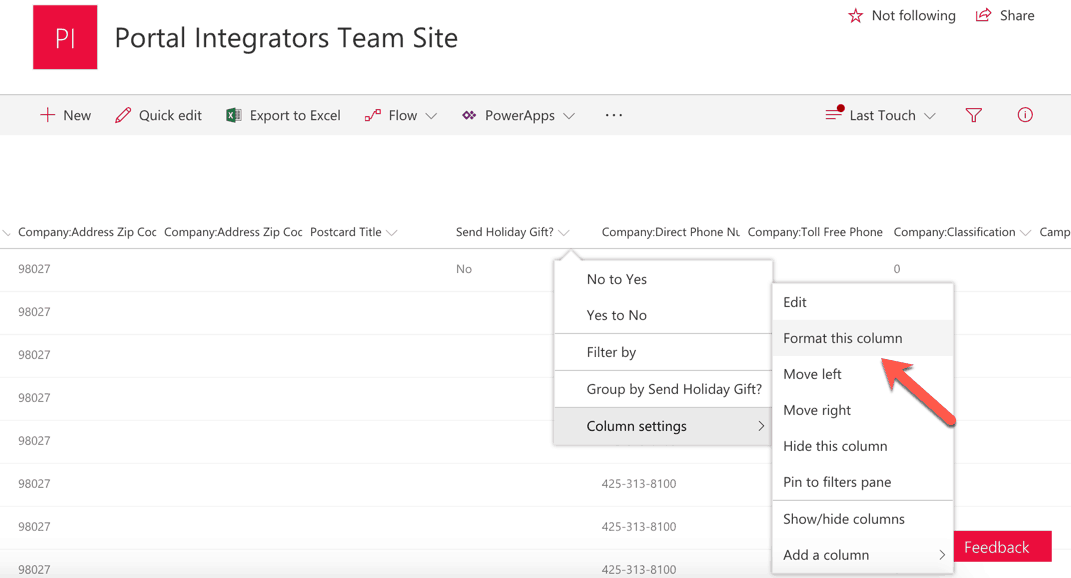
We will start with something simple. Click the dropdown next to any column on the list. Select Column Settings and then click Format this column. Format column panel will be shown on the right.
Changing the display of the selected column, like mentioned above would require adding code in JSON format. Let us go quickly through the JSON code. We just defined the schema of the JSON on the first part and then set the debug mode to true. div is the element to create where we just specified that the content will be applied with a gray background-color, the text color is white and we also added some left padding.
Click Save to save changes. The output, from what we can see on the left is the selected column with gray background and with content in white color and slightly indented.

What we did shows just some basic formatting that we can perform on these list columns. Although this should be enough to get us started, there are just scenarios where we need to do something more advanced than what we did in the previous example. What if we want a color-coded view of the items, for example, highlight items in different colors based on the field value? To do column formatting based on conditional logics, we will be using expression objects. These usually contain operator and operands that are evaluated in the context at runtime.
Operands specifies parameters for an expression while Operators on the other hand, specify the operation that needs to be performed which includes the following:
- +
- –
- /
- *
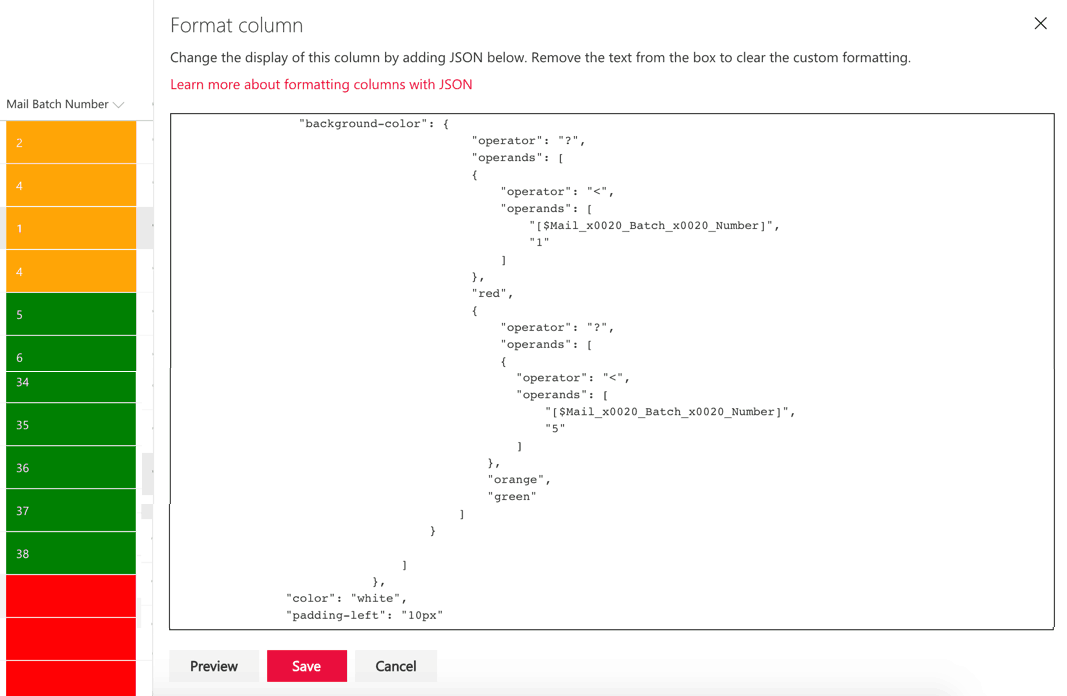
Let us work on one example. We basically have 3 conditions where we are setting the background color of the current field to red if value of the Mail Batch Number column is less than 1, orange if less than 5. Otherwise highlight the row with green. We used the ? operand where we have the 3 arguments, the test, the value if true, and the value if false. The formatting was based on the value of Mail Batch Number column.
Let us work on one example. We basically have 3 conditions where we are setting the background color of the current field to red if value of the Mail Batch Number column is less than 1, orange if less than 5. Otherwise highlight the row with green. We used the ? operand where we have the 3 arguments, the test, the value if true, and the value if false. The formatting was based on the value of Mail Batch Number column.
The last example is still relatively easy, but you get the idea. We can have it more complex with nested operands and operators. The important thing though is to be familiarized with the JSON syntax. Once you are quite comfortable with the JSON syntax, you will be able to work on more advanced formatting. Some of the examples are showing checks on Yes/No columns, progress bars, and the list goes on. That said, column formatting is helpful in such a way that it allows us to include visual indicators for improved user experience.
Send us your questions on SharePoint
Related Blog Post
The Joy it Gives
This blog has been quiet for over a year. Of course, I have to write my first post after a long time while experiencing flaky internet. Such has been the last few months for us - a lot of changes sometimes wanted and some surprises. Two of our For Dummies books...
SharePoint Cross-Domain Library Part 1: Getting To Know The Library
We have attempted to have an in-depth understanding of how permissions work in SharePoint add-ins in a blog post here and have mentioned a thing or two about the need for the cross-domain library when doing cross-domain calls. When you have for example built an app...
Creating An Information Management Policy in SharePoint
Information management policies are a set of rules that allows organizations to control content, such as setting retention period or defining actions that can be taken for a specific content. This helps organizations in enforcing regulations within their internal...

